Julius AI
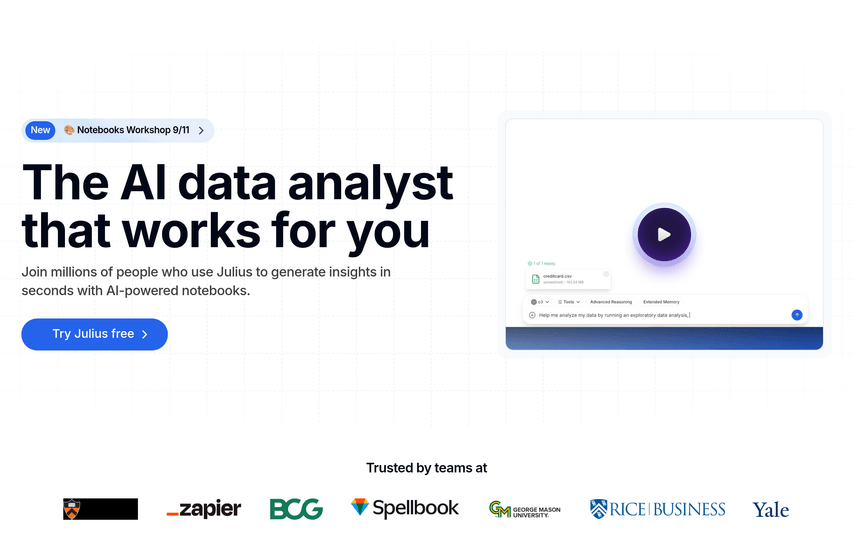
AI data analyst that can create charts and graphs from your data through chat prompts.
About
Julius AI is a conversational data analysis tool that allows you to connect various data sources (like spreadsheets, Excel files, and databases) and analyze them using simple chat prompts. You can ask it to visualize data, create charts and graphs, perform calculations, and generate insights without writing any code.
Key Features
Conversational Analysis
Analyze data by asking questions in plain English.
Instant Visualizations
Generate charts, graphs, and heatmaps on the fly from your data.
Multiple Data Sources
Connects to Excel, Google Sheets, CSV files, and PostgreSQL databases.
How to Use Julius AI
Upload your data file or connect a data source. Then, start asking questions in the chat interface, like 'Create a bar chart of sales by region' or 'What is the monthly growth rate?'
Use Cases
Frequently Asked Questions
Q: What kind of charts can it create?
A: It can create a wide variety of charts, including bar charts, line graphs, pie charts, scatter plots, and more.
Q: Is it secure to upload my company's data?
A: Julius AI states that they prioritize data security, but users should always review the platform's privacy policy before uploading sensitive information.
Q: Can it perform complex statistical analysis?
A: It can handle many common calculations and analyses. For highly complex statistical modeling, a dedicated statistical software might be more suitable.
