Finorify
Finorify makes fundamental stock analysis easy with visual quarterly charts and insights.
About
Finorify makes stock analysis simple, visual, and beginner friendly. No jargon. No confusion. Just clear charts and insights that help you understand what truly drives a company. See quarterly financial performance at a glance, explore fundamental metrics, and follow trends that matter most to long term investors. Designed for stock pickers who prefer real fundamentals over speculation, Finorify helps you cut through the noise and focus on what’s important. Perfect for new investors looking to learn, grow, and build a smarter investing habit.
Key Features
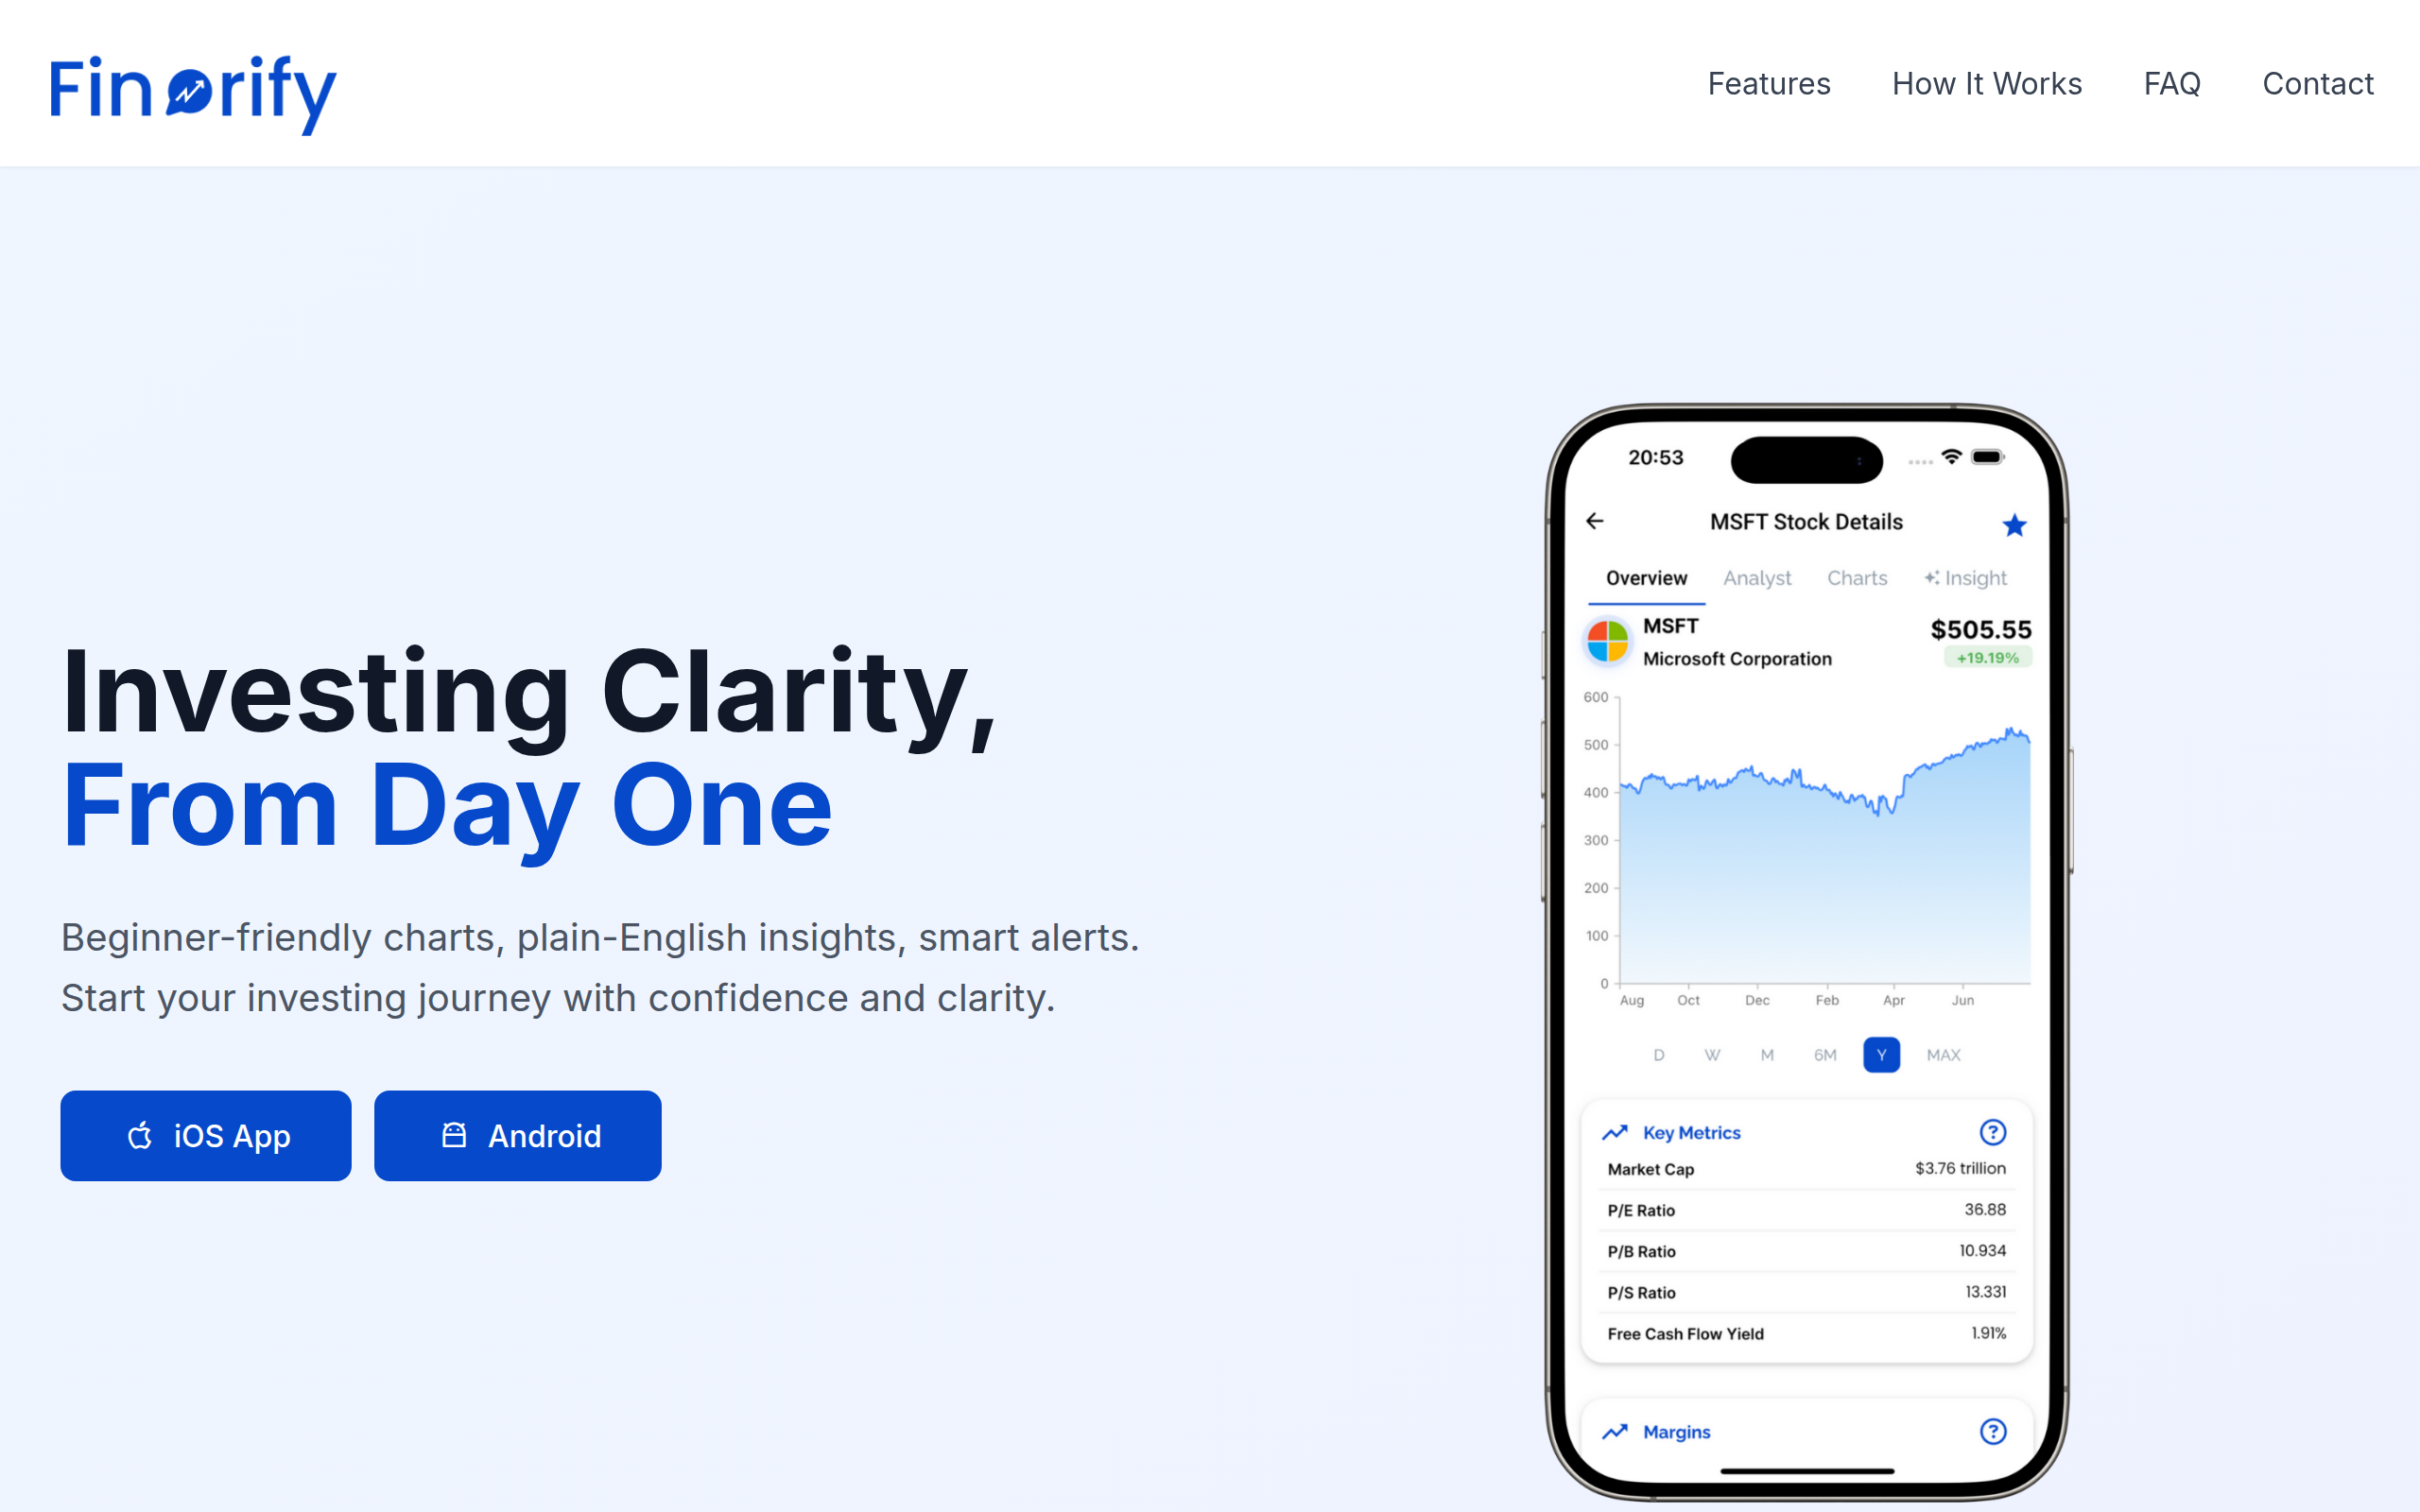
Visual Quarterly Charts
Interactive charts showing 40+ quarters of financial data (revenue, EPS, free cash flow, balance sheet metrics) so you can spot long-term trends at a glance.
Plain-English Insights
Concise, jargon-free explanations and quick takeaways that translate financial metrics into what they mean for investors, ideal for beginners.
Watchlists & Smart Alerts
Create and organize watchlists, receive earnings reminders and key event notifications to stay on top of stocks you follow.
Analyst Ratings & Price Targets
View aggregated analyst ratings and price targets to complement your fundamental research and compare market sentiment.
How to Use Finorify
1) Install the iOS or Android app and open Finorify. 2) Search for a company or browse stock ideas and open a stock profile. 3) Review the Fundamentals tab to see quarterly charts (revenue, EPS, cash flow, balance sheet) and read the plain-English insights and quick takeaways. 4) Add stocks to a watchlist, enable earnings alerts, and follow analyst ratings to track updates and stay organized.